|
|
Post by Blitz on Apr 16, 2024 12:01:26 GMT -5
March 2024 www.spglobal.com/commodityinsights/en/ci/products/oil-gas-drilling-rigs-offshore-day-rates.htmlDay rates published by S&P Global are presented in good faith based on our best understanding of the market at the time, and may be subject to adjustment. Day rates are charted as an average of the high and low for each month. Utilization is the percentage of contracted rigs out of the total competitive fleet supply. The data is updated on or about the 15th of each month. The data points used to derive the averages are available to subscribers to Petrodata Rigs market intelligence tools. 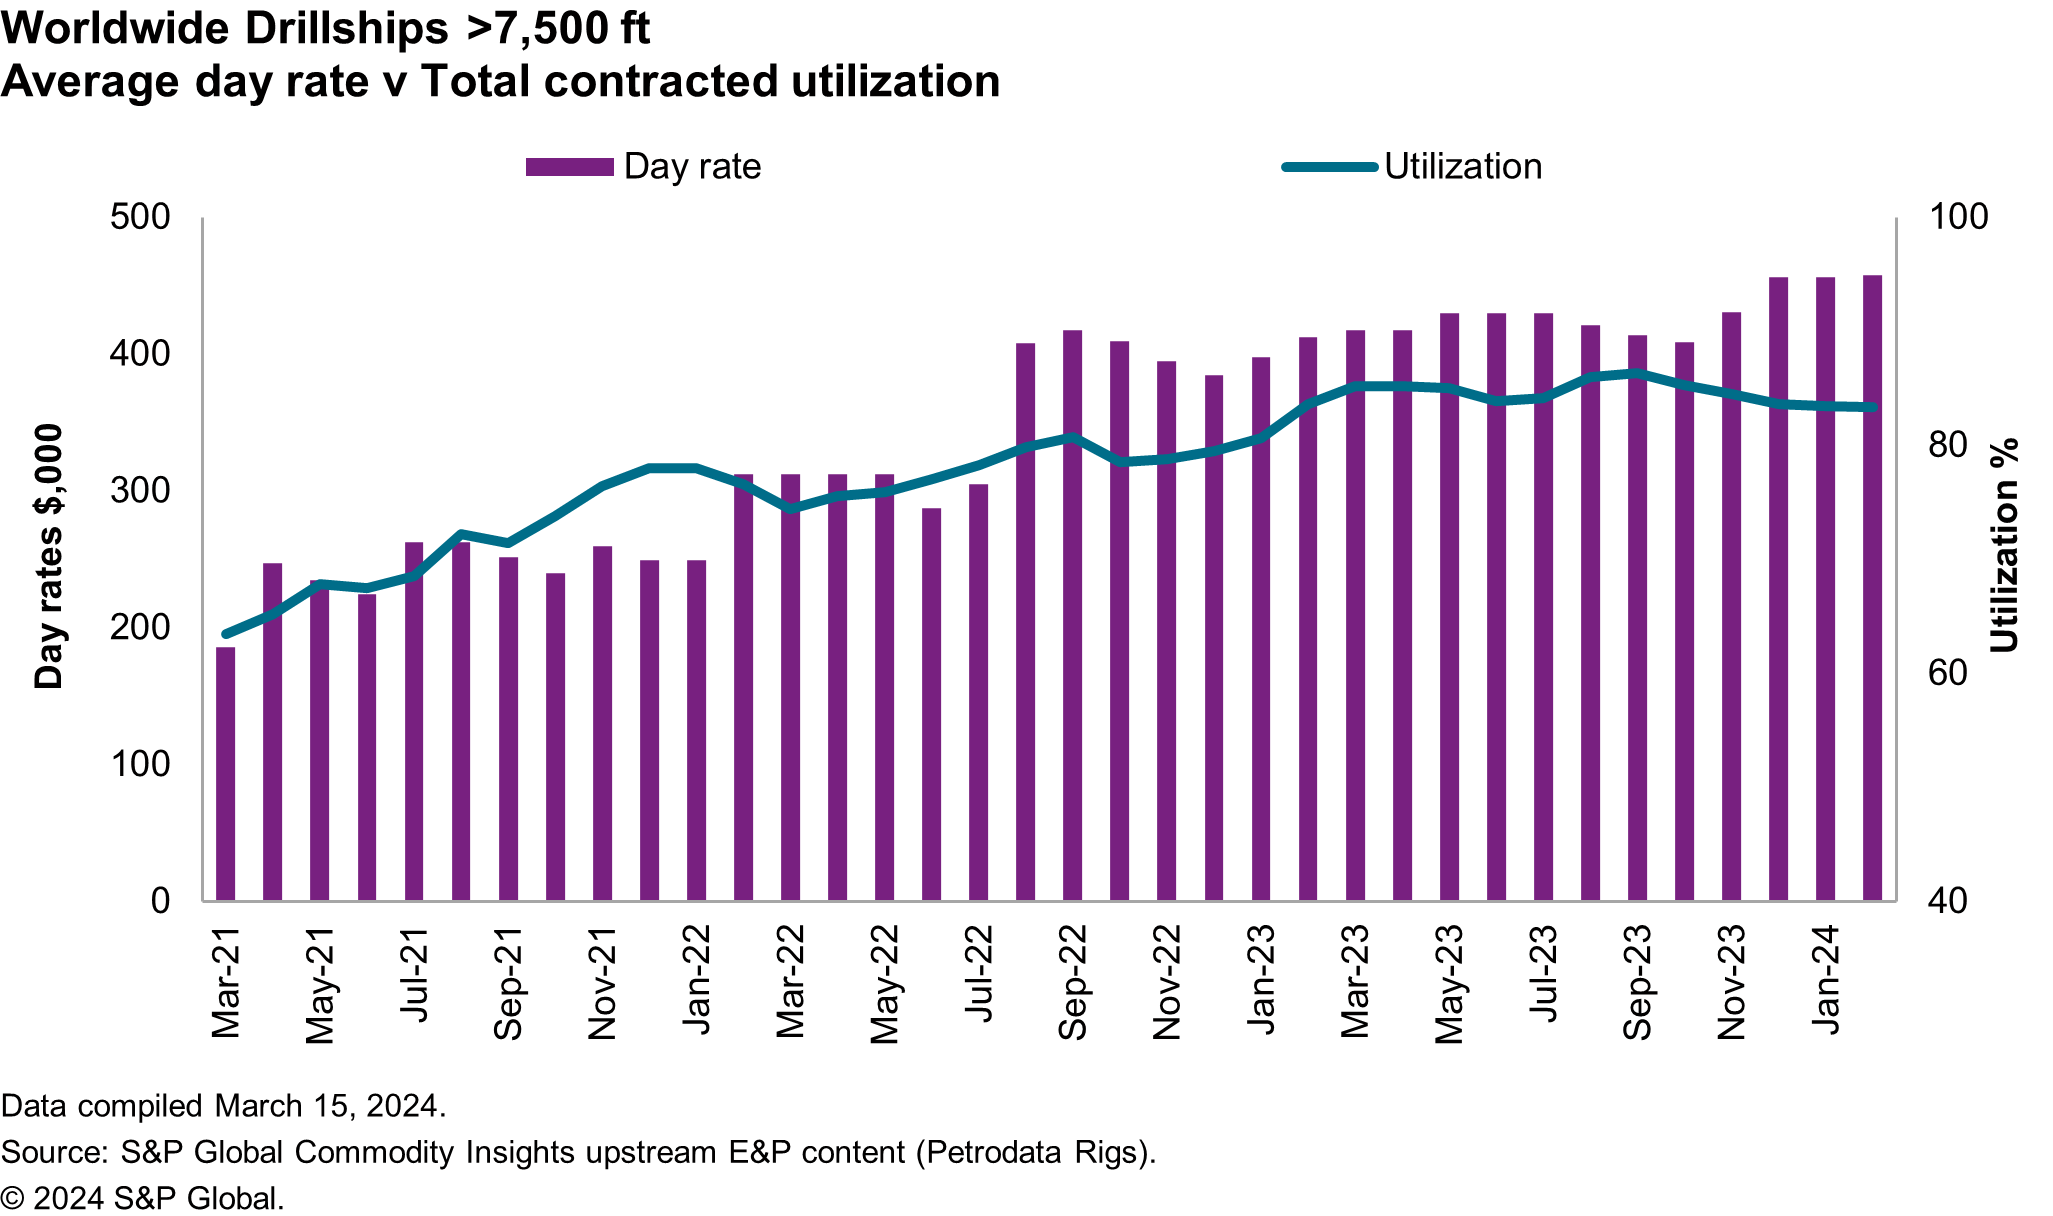  |
|
|
|
Post by bjspokanimal on Apr 16, 2024 17:52:19 GMT -5
Downward trajectory of utilization is stabilizing. For those who are confused about why utilization has been declining even as the market for drillships has been reportedly tightening, remember that these graphs include ALL rigs owned by drilling companies, whether cold-stacked, warm-stacked or active.
Let me provide an example of the dynamic here:
Valaris signed an agreement last fall to buy 2, stranded drillships from a shipyard, the ds-13 and ds-14 I believe they were dubbed. Upon taking delivery of those ships, the entered the global fleet because Valaris could market them and the shipbuilder could not. So suddenly, there were 2 more drillships in the global fleet and they were stacked, which had the effect of pushing the "utilization" graph down in the illustration above.
|
|


